International | Jan 12 2022

Part 2 of a deep dive in today's consequences from a decade, and more, of exceptionally low interest rates by Ahead of the Herd's Rick Mills.
The Debt Trap Part 2 of 3: 50 Years Of Fiat Folly
Richard (Rick) Mills
Ahead of the Herd
As a general rule, the most successful man in life is the man who has the best information.
A year and a half into the covid-19 battle, with no end in sight as countries hit with the delta variant are forced to re-instate restrictions, the world has never been more in the red.
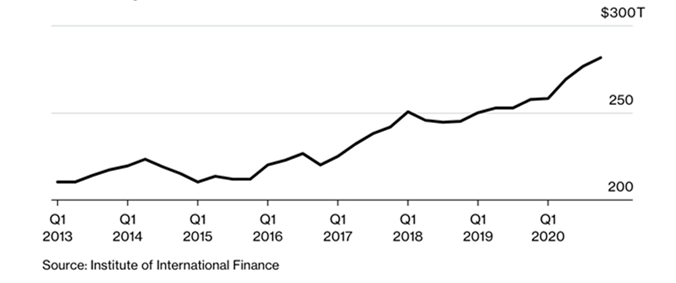
The Institute of International Finance found that governments, companies and households raised $24 trillion last year to offset the pandemic’s economic toll, bringing total global debt to an all-time high, at the end of 2020, of $281 trillion.
Even with vaccine rollouts, low interest rates worldwide are keeping debt above pre-pandemic levels. The Federal Reserve continues to purchase $120 billion per month in government bonds and mortgage-backed securities as part of its quantitative easing policy. The Bank of Canada’s QE program was scaled back in July but is still being maintained at $2 billion per week, despite over 80% of the country fully vaccinated against the coronavirus.
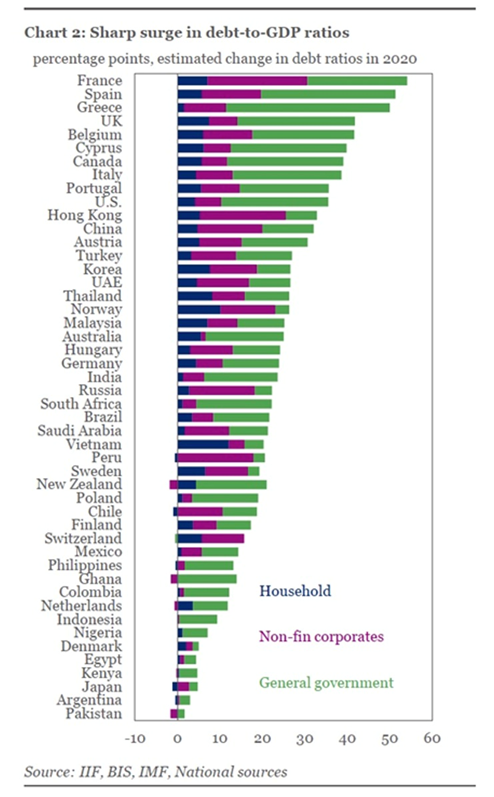
The IIF estimated in February that governments with large budget deficits are expected to add another $10 trillion in 2021, pushing their global debt accumulation past $92 trillion by 2021’s end.
Last year, South Africa and India had the biggest increases in government debt ratios, with China seeing the biggest jump in emerging markets, followed by Turkey, Korea and the United Arab Emirates.
Among mature economies, France and Spain had the sharpest increases in non-financial industry debt to GDP ratios, IIF data showed.
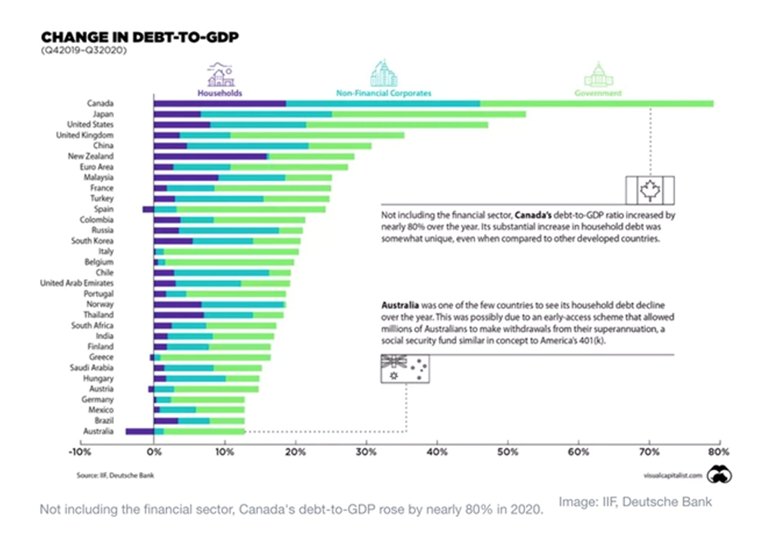
Another set of figures, via the World Economic Forum (WEF), found that falling revenues combined with costly pandemic relief measures increased global debt by $20 trillion between the third quarter of 2019 and the end of 2020. Excluding the financial sector, Canada’s debt to GDP ratio climbed by nearly 80% last year, the highest of any developed country. Not only did the country’s GDP plunge 38% in the second quarter, the worst three-month performance on record, government borrowing surged, with the Canada Emergency Response Benefit (CERB) ringing up a bill of $60 billion over seven months, according to the WEF.
In a December 2020 report, RBC Wealth Management contributed more illuminating statistics that paint a grim picture of a growing global debt burden powered by pandemic-related borrowing.
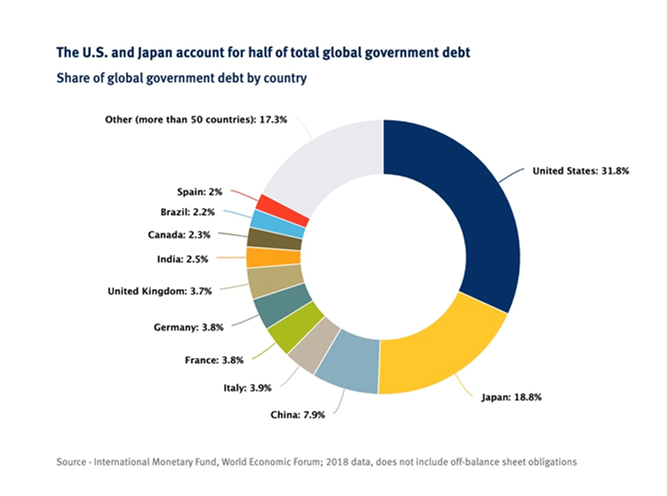
The Canadian bank quoted the IMF in stating that the public debt of advanced economies has climbed nearly 27% since January 2020, and now sits beyond the greater than 120% of GDP reached after World War II. The United States and Japan are the two most indebted economies accounting for half of total global government debt (see the pie chart below).
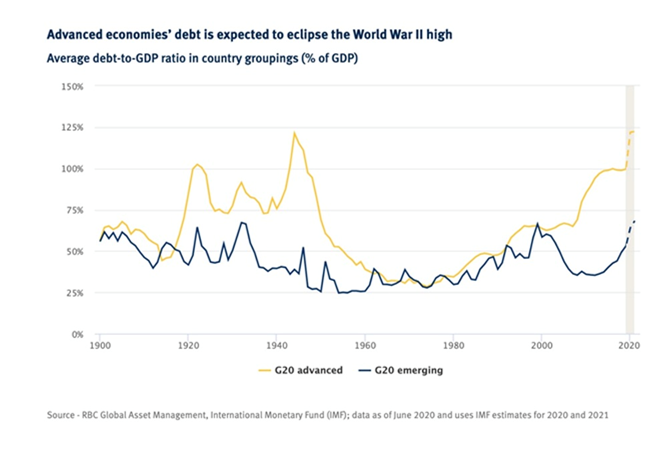
Global debt is a tamer 102% of GDP because many of the largest emerging economies have lower debt burdens, however it’s still a record, noted RBC.
The United States is the obvious poster child of excessive debt accumulation.
According to usdebtclock.org, the current national debt sits at $28.7 trillion, and it is increasing with each tick of the clock.
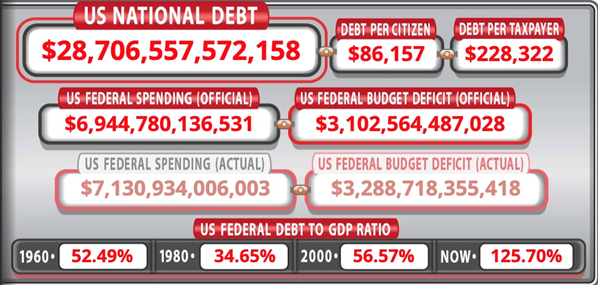
Source: usdebtclock.org
The next round of government spending involves President Joe Biden’s $1 trillion infrastructure bill, just passed by the Senate but not yet approved by the House; and a $3.5 trillion anti-poverty and climate plan Senate Democrats hope to get passed this fall.
Debt is clearly a major limitation on a growing economy.
According to the World Bank, if the debt to GDP ratio exceeds 77% for an extended period of time, every percentage point of debt above this level costs a country 0.017 percentage points in economic growth. The US is currently at 125.7%, so that is 48.7 basis points multiplied by 0.017 = 0.82, nearly a full percentage point of economic growth!
The Balance notes that a combination of recessions, defense budget growth and tax cuts has raised the debt to GDP ratio to record levels. Throughout the years, US military spending has been a major contributor to the debt. During the First Iraq War in 1991, the debt to GDP ratio hit 54%. Between 2001 and 2020, America’s War on Terror consumed $6.4 trillion, helping to elevate the debt to GDP ratio from 55% in the year of 9/11, to 127% in 2020.
The current national debt of $28.7 trillion, and the current debt to GDP ratio of 125.7%, doesn’t include the $1 trillion infrastructure bill before the House; nor the $3.5T anti-poverty and climate plan.
We also have to add the federal budget numbers. President Biden’s budget for full year (FY) 2022 totals $6.011 trillion, more than any other previous budget. The US government estimates that for FY 2022, revenues will again fall short of expenditures, leaving a $1.8 trillion deficit. Better than the projected $3 trillion deficit for 2021 — almost the same as last year’s $3T — but it still means nearly $2 trillion will be added to the national debt. (CNBC notes the budgetary shortfall this year is equivalent to 13.4% of GDP, the second-largest level since 1945 and exceeded only by 2020 spending)
Adding it all up, you get $28.7T (national debt) + $1 trillion (infrastructure bill) + $3.5T (anti-poverty and climate plan) + $6T (FY 2022 budget spending) + $3T (2021 deficit) + $1.8T (2022 deficit) = $44T. By 2022 the national debt, presuming all of the spending commitments use borrowed (or printed) money, will be approaching $44 trillion!
The Fed is severely constrained in how much it can raise interest rates, to quell rising inflation, due to ballooning debt. Following $4.5 trillion spent on pandemic relief, and trillions more to come, through Biden administration spending, along with the continuation of quantitative easing (what I like to call “quantifornication”) to the tune of $120 billion in asset purchases per month, the Fed has in one year doubled its balance sheet to around $8.3 trillion.
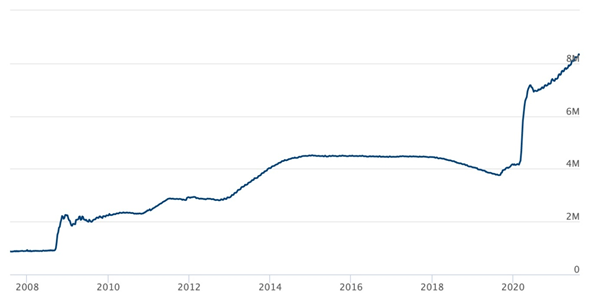
Source: US Federal Reserve
According to the Committee for a Responsible Federal Budget, the federal government this year will spend $300 billion on interest on the national debt. This is the equivalent of 9% of all federal revenues collected or more than 2,400 per household.
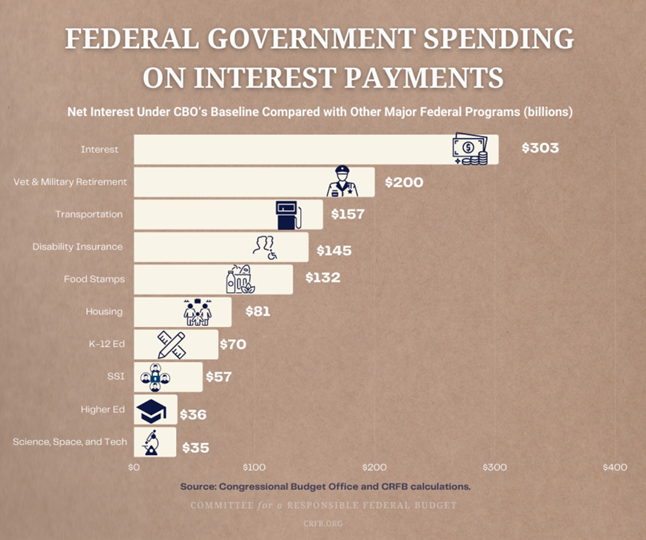
A today’s debt levels, each 1% rise in the interest rate would increase interest expenditures by roughly $225 billion. On a per-household basis, a 1% interest rate hike would increase interest costs by $1,805, to $4,210.
Quantitative easing, or QE for short, is a technique used by the US Federal Reserve and other central banks to stimulate the economy in times of crisis. The Fed buys up securities from its member banks, thereby adding new money to the economy (this is where the expression, the Fed is “printing money” comes from). It’s a way of funding new expenditures, without actually dipping into the federal budget.
The idea is to free up more money for banks to make loans to individuals and businesses, thus growing the economy. The money is not cash, but credit that is added to banks’ deposits. When it wants to print money, the Fed lowers the benchmark federal funds rate, and banks in turn lower their interest rates, making capital more affordable so that businesses and investors are more likely to borrow.
The Fed used quantitative easing in the wake of the 2008-09 financial crisis and it did so again in 2020 to deal with the coronavirus pandemic. (QE continues although the Fed has stated it wants to start “tapering” its monthly asset purchases)
QE was successful in preventing a financial meltdown during 2008 and 2020, but the effect has been a reliance on cheap credit that has fueled both a stock market bubble and a real estate bubble that many observers believe is in danger of popping. Bond investors have also become addicted to Fed stimulus.
Excessive money-printing not only in the United States, but Britain and the EU, is continuing to devalue currencies at an alarming rate (this, by definition, is inflation, because it takes more units of currency to buy the same amount of goods as before) — for which precious metals, namely gold and silver, are the best defence.
The Nixon Shock
The world’s obsession with debt didn’t begin with the coronavirus; the seeds of government debt accumulation were planted five decades ago.
It seems fitting that the year we are seeing an unprecedented rise in US government spending and money-printing to spur an economic recovery, marks the 50th anniversary of the end of the gold standard.
Done at the time to fight an economic crisis, we are still feeling the effects of this disastrous decision.
In 1968, an excess of dollars in the global economy threatened the gold standard, whereby the Federal Reserve redeemed US$35 for an ounce of gold. As explained by The Balance,
In 1968, the United States had over $45 billion in Federal Reserve note liabilities but held only about $10 billion in gold. It was not enough to redeem the liabilities.? Foreign holders turned in their dollars for gold, depleting central banks’ gold reserves even more.? To make the dollar more attractive to hold, the Federal Reserve raised interest rates to 6%.
But the run on gold continued. It boosted inflation to 6.2% in 1969, Nixon’s first year in office.? The Fed defended the gold standard by raising rates to 9.19%. Unfortunately, it also created a mild recession that started later that year. By the end of 1970, the unemployment rate had risen to 6.1%.
The mismatch of dollars to gold meant that governments or their central banks could show up at any time to the US Treasury’s “gold window” and demand gold for dollars. In August 1971, the British Ambassador did just that, requesting that $3 billion be converted into gold.
In 1970 then-Federal Reserve Chairman Arthur Burns declared that the economy was no longer operating as it used to, due to the growing power of corporations and unions, which together, were driving up wages and prices. The answer, in Burns’ view, was to impose wage-price controls, wherein an appointed wage-price review board would pass judgment on major wage and price increases.
As Nixon looked towards re-election in ’72, he wasn’t going to let the economy bring him down again in a repeat of 1960.
As PBS describes in an excellent essay titled ‘Nixon, Price Controls and the Gold Standard’, The central economic issue became how to manage the inflation-unemployment tradeoff in a way that was not politically self-destructive; in other words, how to bring down inflation without slowing the economy and raising unemployment.
To figure out a way forward, Nixon and 15 advisors repaired to the presidential retreat at Camp David. The answer was the New Economic Policy, wherein wages and prices would be frozen for 90 days as a way of attacking inflation. The idea was that wage-price controls would allow the administration to pursue a more expansive monetary policy, thereby stimulating employment in time for the 1972 election without stoking inflation.
“Now I am a Keynesian,” Nixon declared in January 1971, before introducing a “full employment” budget, which provided for deficit spending to reduce unemployment.
More ominously, the gold window was to be closed, something Fed Chair Burns disagreed with. “Pravda would write that this was a sign of the collapse of capitalism,” he warned, but was over-ruled.
Closing the Treasury’s window for gold redemptions immediately weakened the dollar, which added to inflation by driving up the prices of imported goods. As the PBS essay reminds us, Going off the gold standard and giving up fixed exchange rates constituted a momentous step in the history of international economics.
Closing the gold window was controversial, but the naysayers were shouted down, and Nixon was re-elected in 1972, winning every state except Massachusetts.
How will Nixon be judged for ending the gold standard? As it turns out, quite harshly.
In 1973 the president devalued the dollar, making an ounce of gold worth $42 instead of $35. This resulted in a selloff in greenbacks for gold, and by the mid-1970s inflation was in the double digits. Later in ‘73 Nixon decoupled the dollar from gold completely, which made the price of bullion soar to $120 per ounce and ended the 100-year history of the gold standard.
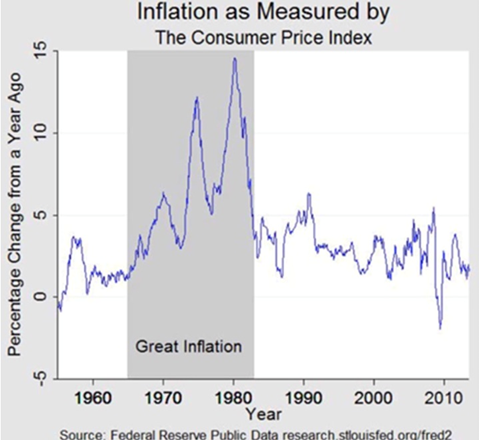
Quitting the gold standard resulted in stagflation. Falling growth + high inflation + high unemployment was only cured by double-digit interest rates which caused the 1981 recession.
Removing the dollar’s peg to gold also opened the door to allowing the US government to print money to solve every economic problem, ensuring the greenback’s value would fall indefinitely. This is exactly what has happened.
Inflation erodes the purchasing power of fiat currencies and eventually they become worthless.
The dollar has lost 90% of its purchasing power since 1950.

By contrast, since 1972 gold has gone from $35/oz to $1,800.
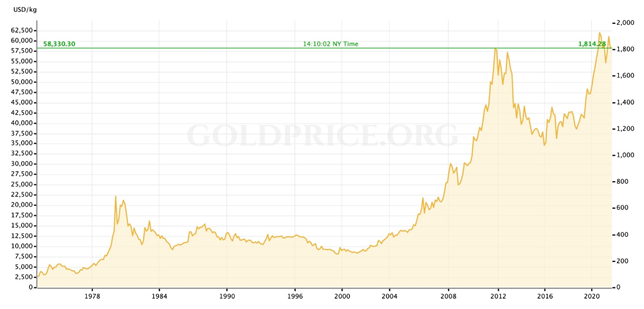
Source: goldprice.org
In the 50 years since the gold standard was eliminated, unemployment has stuck above 5% in all but 12 years. These figures look particularly bad when compared to the gold standard era. Between 1947 and 1970, unemployment averaged less than 5% and never rose above 7%.
Economic growth has been sluggish too. Whereas GDP grew 4% a year during the post-War gold standard period, between 1971 and 2011, real economic growth (after inflation) averaged 2.9%, compared to 4% during the gold standard era.
Since Nixon killed the gold standard, there have been 13 financial crises, including the 1973 oil shock, the financial crisis of 2008-09 and the coronavirus crisis of 2020-21.
As Forbes concludes,
The evidence is in. The great experiment of a paper dollar managed by able men and women has failed and failed miserably to keep any of its promises.
Conclusion
Our conclusion at AOTH is much the same. Nixon was persuaded, against his better judgment, to try beating inflation in 1971 by imposing wage and price controls. He did this essentially to get re-elected. But Nixon went further in committing what must be seen in retrospect as a colossal blunder in removing the fixed link between the dollar and gold.
The move killed the dollar, which has been losing value ever since. Why? Because successive governments and central banks have taken it upon themselves to create money (ie. the Fed) and spend money (the Treasury) with no consequences, something that could never happen if the dollar had a gold anchor. Going back to it, monetary/fiscal policy would be much restricted, for sure, but neither could the federal government be allowed to run up the debt to its current $28.7 trillion, in the fall of 2020 exceeding the debt to GDP ratio by 100% for the first time since the Second World War.
There would also be no unfettered growth of the money supply, which is inflationary, and no expansion of the Fed’s balance sheet to over $8 trillion.
Nixon’s historic decoupling of gold and the dollar has important ramifications for the current US economy, and investors.
What happens when people realize the federal government has depreciated the greenback by spending at least $6 trillion using borrowed money, plus the Fed’s $8 trillion, meaning the purchasing power of the dollar has been cut in half? The equivalent of half the $28-trillion national debt? And with trillions more debt to come, at AOTH we believe there is only one direction for the dollar, and only one way for gold.
Yet people are being misled into believing that the US Federal Reserve is going to scale back its $120 billion per month asset purchase program (QE) and raise interest rates. The Fed can telegraph its intentions all it wants, the fact remains that at such unsustainably high debt levels, the interest payments will eventually cripple the federal government.
In 2019, before the coronavirus crisis, the Committee for a Responsible Federal Budget (CRFB) calculated that under current law, net interest payments will nearly triple over the next decade, to $928 billion by 2029. In 2019 the national debt stood at $23.2 trillion compared to the current $28.7 trillion, so already we know the projections are too conservative. Remember the current debt doesn’t include the $1 trillion infrastructure bill before the House; nor the $3.5T anti-poverty and climate plan; nor President Biden’s budget for full year (FY) 2022 totaling $6 trillion, more than any other previous budget.
Under the CRFB’s “Alternative Fiscal Scenario” which assumes that lawmakers extend the tax cuts and spending passed under the Trump administration, interest on the debt will exceed $1 trillion by 2029.
(As a concession to Senate Republicans, Joe Biden earlier this year proposed keeping intact Donald Trump’s 2017 tax cuts. Instead of raising corporate taxes to pay for the $1 trillion infrastructure plan, his administration would work to ensure corporations don’t exploit tax loopholes)
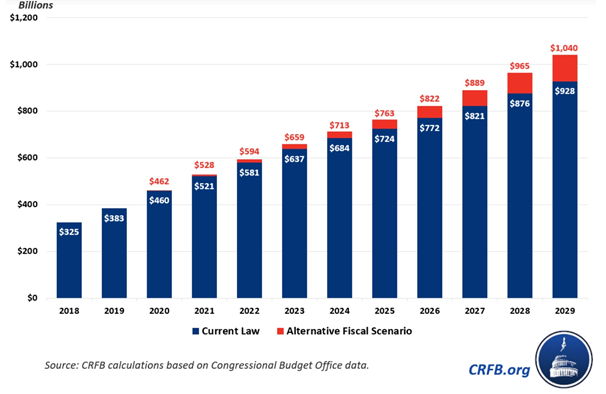
Again, this is before the $4.5 trillion already spent on covid and the trillions more to come. The way we’re going, interest payments on the debt will almost certainly top $1 trillion by the end of the decade if not before.
Some see the national debt going much higher, given that the way it is calculated now, doesn’t include unfunded Social Security and Medicare promises. When that $129 trillion worth of bills is added, “the truth” is closer to $133 trillion.
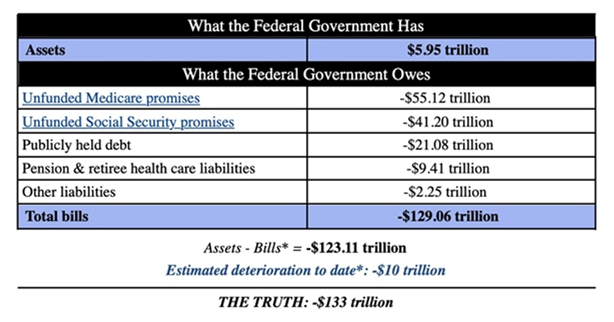
Source: Truth in Accounting
Now we are talking about interest payments of four to five times the current $300 billion, ie., $1.2T to $1.5T. The people supposedly represented by the government can’t afford that level of interest (they will suffer higher interest payments on their own debt), same as businesses cannot afford higher interest payments on their debt. Corporations will simply pass on the higher interest obligations to their customers, cut dividends or in the worst case scenarios, lay off staff.
Without a plan to reduce the debt, the era of “free money” will continue, benefiting gold and silver prices for the foreseeable future.
Richard (Rick) Mills
aheadoftheherd.com
The story above was originally published in September 2021.
Richard is the owner of Aheadoftheherd.com and invests in the junior resource/bio-tech sectors. His articles have been published on over 400 websites, including:
WallStreetJournal, USAToday, NationalPost, Lewrockwell, MontrealGazette, VancouverSun, CBSnews, HuffingtonPost, Londonthenews, Wealthwire, CalgaryHerald, Forbes, Dallasnews, SGTReport, Vantagewire, Indiatimes, ninemsn, ibtimes and the Association of Mining Analysts.
If you're interested in learning more about the junior resource and bio-med sectors, and quality individual company’s within these sectors, please come and visit us at www.aheadoftheherd.com
Content included in this article is not by association necessarily the view of FNArena (see our disclaimer).
Legal Notice / Disclaimer
This document is not and should not be construed as an offer to sell or the solicitation of an offer to purchase or subscribe for any investment.
Richard Mills has based this document on information obtained from sources he believes to be reliable but which has not been independently verified.
Richard Mills makes no guarantee, representation or warranty and accepts no responsibility or liability as to its accuracy or completeness. Expressions of opinion are those of Richard Mills only and are subject to change without notice. Richard Mills assumes no warranty, liability or guarantee for the current relevance, correctness or completeness of any information provided within this Report and will not be held liable for the consequence of reliance upon any opinion or statement contained herein or any omission.
Furthermore, I, Richard Mills, assume no liability for any direct or indirect loss or damage or, in particular, for lost profit, which you may incur as a result of the use and existence of the information provided within this Report.
Technical limitations
If you are reading this story through a third party distribution channel and you cannot see charts and various illustrations included, we apologise, but technical limitations are to blame.
Find out why FNArena subscribers like the service so much: "Your Feedback (Thank You)" – Warning this story contains unashamedly positive feedback on the service provided.
FNArena is proud about its track record and past achievements: Ten Years On