International | Jan 10 2022

Part 1 of a deep dive in today's consequences from a decade, and more, of exceptionally low interest rates by Ahead of the Herd's Rick Mills.
Richard (Rick) Mills
Ahead of the Herd
As a general rule, the most successful man in life is the man who has the best information.
The US Federal Reserve is severely constrained in how much it can raise interest rates, to quell rising inflation, due to ballooning debt.
The United States is much more highly indebted than it was in 2010 following the Great Recession, which restricts its borrowing capacity. The federal government is facing a $3 trillion deficit this year, the second in a row, and the interest it must pay on the debt amounts to nearly half a trillion dollars.
According to usdebtclock.org, the current national debt sits at $28.6 trillion, and it is increasing with each tick of the clock.
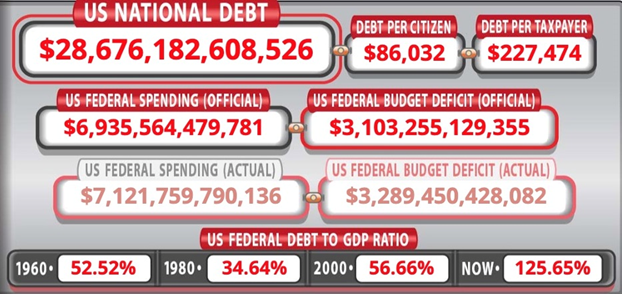
Source: usdebtclock.org
There are three kinds of debt: government, corporate and household.
Sixteen months into the covid-19 battle, and no end in sight as countries are being hit with the highly contagious Delta variant and forced to re-instate restrictions, the world has never been more in the red.
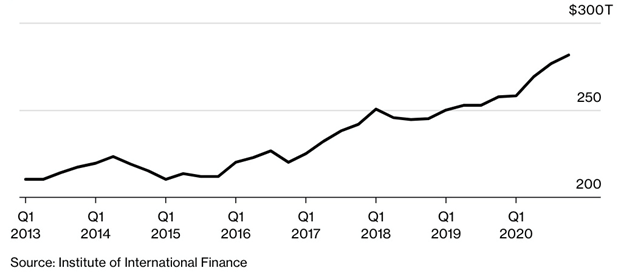
The Institute of International Finance found that governments, companies and households raised $24 trillion last year to offset the pandemic’s economic toll, bringing total global debt to an all-time high, at the end of 2020, of $281 trillion.
Government debt
Even with vaccine rollouts, low interest rates worldwide are keeping debt above pre-pandemic levels. The Federal Reserve continues to purchase $120 billion per month in government bonds and mortgage-backed securities as part of its quantitative easing policy. The Bank of Canada’s QE program was scaled back in July but is still being maintained at $2 billion per week, despite over 80% of the country fully vaccinated against the coronavirus.
The IIF estimated in February that governments with large budget deficits are expected to add another $10 trillion in 2021, pushing their global debt accumulation past $92 trillion by 2021’s end.
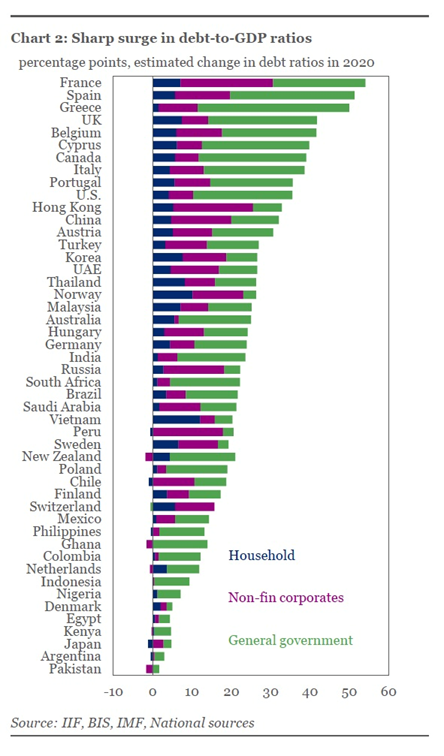
Last year, South Africa and India had the biggest increases in government debt ratios, with China seeing the biggest jump in emerging markets, followed by Turkey, Korea and the United Arab Emirates.
Among mature economies, France and Spain had the sharpest increases in non-financial industry debt to GDP ratios, IIF data showed.
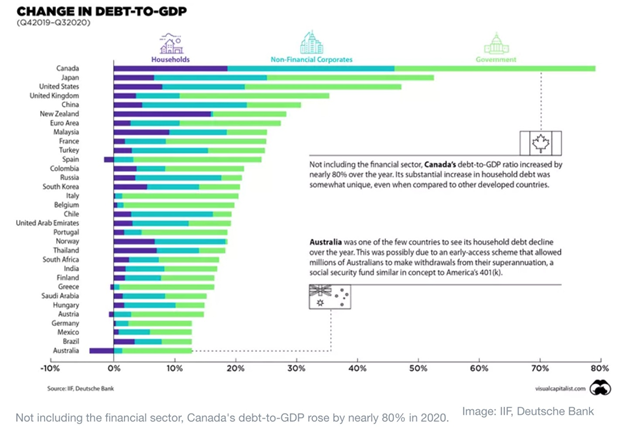
Another set of figures, via the World Economic Forum (WEF), found that falling revenues combined with costly pandemic relief measures increased global debt by $20 trillion between the third quarter of 2019 and the end of 2020. Excluding the financial sector, Canada’s debt to GDP ratio climbed by nearly 80% last year, the highest of any developed country. Not only did the country’s GDP plunge 38% in the second quarter, the worst three-month performance on record, government borrowing surged, with the Canada Emergency Response Benefit (CERB) ringing up a bill of $60 billion over seven months, according to the WEF.
In a December 2020 report, RBC Wealth Management contributed more illuminating statistics that paint a grim picture of a growing global debt burden powered by pandemic-related borrowing.
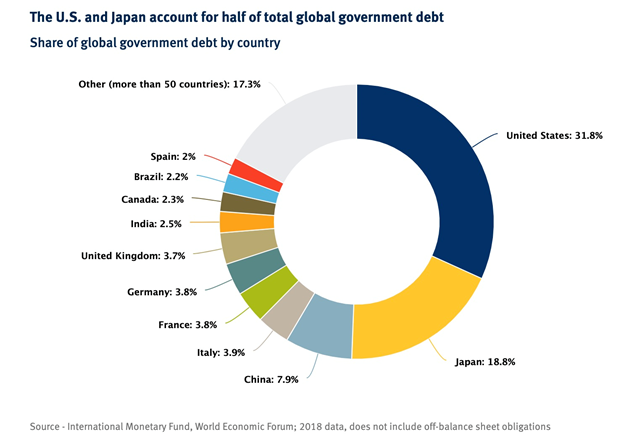
The Canadian bank quoted the IMF in stating that the public debt of advanced economies has climbed nearly 27% since January 2020, and now sits beyond the greater than 120% of GDP reached after World War II. The United States and Japan are the two most indebted economies accounting for half of total global government debt (see the pie chart below).
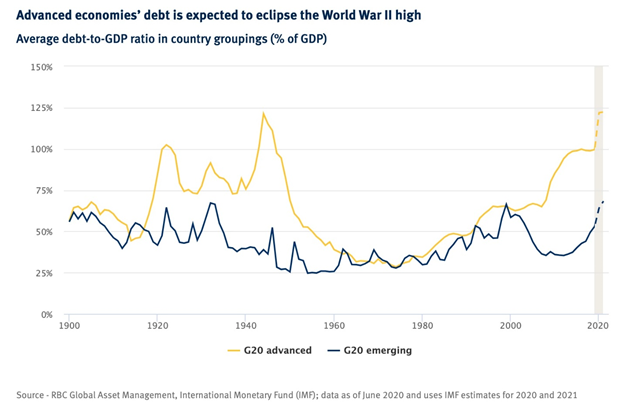
Global debt is a tamer 102% of GDP because many of the largest emerging economies have lower debt burdens, however it’s still a record, noted RBC.
The bank says these official figures underestimate the situation, giving the example of the United States where public debt does not include obligations such as future Social Security and Medicare promises.
When that $129 trillion worth of bills is added, “the truth” about UD debt is that it’s closer to $133 trillion.
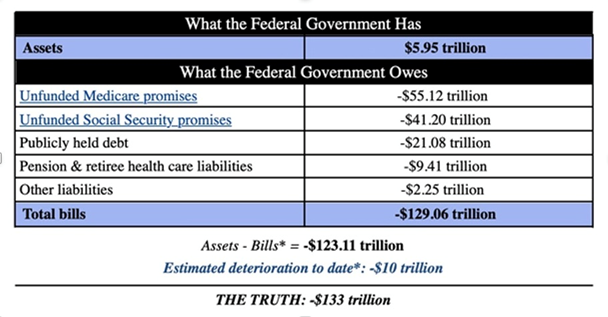
Source: Truth in Accounting
Debt is a major limitation on a growing economy.
According to the World Bank, if the debt to GDP ratio exceeds 77% for an extended period of time, every percentage point of debt above this level costs a country 0.017 percentage points in economic growth.
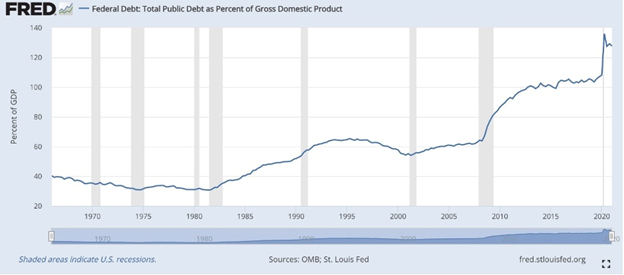
The current US debt to GDP ratio is 125.6%, so that is 48.6 basis points multiplied by 0.017 = 0.82, nearly a full percentage point of economic growth!
However, at the moment the US government and other governments are less concerned about high debt levels squelching growth, because their debt servicing costs are ‘small’ due to ultra-low interest rates.
S&P Market Intelligence notes that despite US public debt more than doubling between 2010 and 2020, interest costs only grew 26%, from $414B to $523B. With net interest just 1.6% in 2020, compared to 3% in 1985, the cost of the national debt is half what it was 10 years ago (but it’s still roughly $400 billion, almost half of the $1 trillion deficit the US government typically runs)
According to the RBC report, federal debt costs actually declined this year, despite outstanding debt surging higher, because there are existing government bond issues carrying higher coupons that are being re-financed at today’s near 0% interest rates. According to Congressional Budget Office estimates, these debt costs are set to move even lower through 2023 and remain so for much of this decade. This, in our opinion, is a significant disincentive for the government to curtail out-of-control spending.
However, Beyond this decade, for the 2030s, as public debt loads swell, RBC Global Asset Management estimates that U.S. debt servicing as a share of GDP will rise to something greater than the average of the last several decades, limiting the government’s ability to cut taxes or spend on desirable government programs.
The United States is the obvious poster child of excessive debt accumulation.
Struggling to contain the economic fallout from the pandemic, the Federal Reserve and other central banks understand that keeping interest rates low and maintaining monthly asset purchases (ie. quantitative easing), have not given the desired economic boost; now they are counting on fiscal policy, ie., government spending and taxes, to do the trick. However, the US government does not have the money, so they borrow (print) it, at current rock-bottom interest rates.
Thus, we have monetary easing happening at the same time as fiscal spending “carte blanche” (remember Biden believes strongly in the power of the state to tax and spend. A long wish list has been, and is waiting to be filled, with little to no concern regarding the already out of control $28 trillion national debt, courtesy of Modern Monetary Theory, or MMT)
The result of these two forces acting together, is bound to create inflation, which climbed to 5.4% in June.
It also explains why inflation is running much hotter than during the financial crisis, when the monetary stimulus stayed within the banks; it did not get out into the greater economy. This time, government stimulus checks went directly to consumers, who squirreled away savings during the pandemic and are back spending en masse, driving up demand beyond available supply in a number of industries, especially food & groceries. Meanwhile the Fed (actually the Treasury) keeps printing away, adding numbers on a computer screen to the tune of $120B per month.
(Remember too, during the Great Recession, the US government bailed out the banks, but it otherwise restricted spending, relying on the Fed’s QE to stimulate the economy. Now we have the opposite occurring, with the Fed growing a fiscal conscience and stating it wants to reduce its $120B per month asset purchases, while the federal government spends like a drunken sailor on a Saturday night shore leave in Prince Rupert.)
Alongside trillions in covid-19 relief already spent, the next round of spending involves US President Joe Biden’s $1 trillion infrastructure bill, just passed by the Senate but not yet approved by the House; and a $3.5 trillion anti-poverty and climate plan Senate Democrats hope to get passed this fall.
The current national debt of $28.6 trillion, and the current debt to GDP ratio of 125.6%, doesn’t include the $1 trillion infrastructure bill heading to the House; nor the $3.5T anti-poverty and climate plan.
We also have to add the federal budget numbers. President Biden’s budget for full year (FY) 2022 totals $6.011 trillion, more than any other previous budget. The US government estimates that for FY 2022, revenues will again fall short of expenditures, leaving a $1.8 trillion deficit. Better than the projected $3 trillion deficit for 2021 — almost the same as last year’s $3T — but it still means nearly $2 trillion will be added to the national debt. (CNBC notes the budgetary shortfall this year is equivalent to 13.4% of GDP, the second-largest level since 1945 and exceeded only by 2020 spending)
Adding it all up, you get $28.4T (national debt) + $1 trillion (infrastructure bill) + $3.5T (anti-poverty and climate plan) + $6T (FY 2022 budget spending) + $3T (2021 deficit) + $1.8T (2022 deficit) = $43.9T. So there you have it. By 2022 the national debt, presuming all of the spending commitments use borrowed (or printed) money, will be approaching $44 trillion!
Despite this exorbitant, unsustainable and frankly terrifying debt pile, there is a disturbing lack of political will to address the situation. RBC in its report states that Within advanced democracies, we think it will be difficult for elected and appointed officials as well as voters to resist the temptation of further debt accumulation. The path of least resistance seems to be pointing toward increasing fiscal spending, not restraint.
Policymakers lack the incentive to address the issue given borrowing costs in the market have remained low despite debt levels spiking. In all likelihood, debt loads will be forced ever higher as further stimulus measures for the COVID-19 crisis are implemented and other crises inevitably hit.
The U.S. may find it easy to turn a blind eye to its growing debt because the U.S. dollar’s status as the world’s reserve currency means there is underlying demand from institutional investors and governments globally for the debt America issues. Given this ease to finance itself and to print money, the U.S. may be even less inclined to reduce debt levels or meaningfully lower its rate of debt accumulation…
Persistent debt accumulation will likely be one more factor that will keep central banks suppressing interest rates over the medium and longer term, further burdening savers and fixed income investors.
According to RBC Global Asset Management, interest rates will need to be permanently lower than before, given that public debt loads will likely permanently remain higher and given there is no obvious, relatively painless way to pay those debts down. Interest rates should rise over time, but they will probably be lower than would otherwise have been the case.
Despite low interest rates, the debt levels may well cap economic growth.
Japan is a case in point. The country has accumulated high levels of debt over the years, reaching 238 percent of GDP in 2018, according to Japan’s Ministry of Finance. It has hovered above 200 percent for 10 years.
There seems to be greater acceptance of high debt loads in the financial community and among government officials in the wake of the pandemic crisis. From a pure “balance sheet” perspective, we believe higher debt loads are manageable in the near and intermediate term. However, at a minimum, high debt levels, while sustainable for the time being in most advanced economies, will eventually restrict governments’ budgetary flexibility and are likely to result in higher tax rates, in our view.
High debt loads will likely also be a powerful incentive for policymakers to further suppress interest rates. This is a key reason we recommend that investors consider strategies for a low interest rate environment that may linger for much longer than one might think is reasonable.
Corporate debt
The idea behind quantitative easing is to get businesses and individuals to take out loans; corporations have been taking full advantage of loose monetary policies particularly low interest rates.
According to the IIF, global debt in the financial sector hit 86% of GDP in 2020, the largest increase since 2007 and the first annual rise since 2016.
The debt of non-financial corporations has also grown significantly, nearly doubling from $46.6 trillion in the second quarter of 2009 to $81T in the third quarter of 2020, says Statista. Chinese corporations had the most debt in 2019, at $21.2T, exceeding US corporate debt of $16T the same year. In the third quarter of 2020, the coronavirus pandemic pushed the debt of nonfinancial corporations worldwide to 101% of global GDP.
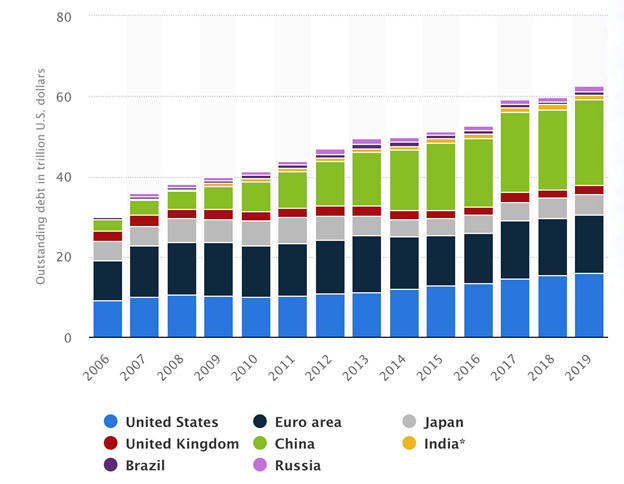
Total debt of non-financial corporations in major developed and emerging economies, 2006-19. Source: Statista
Statista shows US-based telecom firm AT&T carrying the largest long-term debt in 2020, at more than $147 billion, followed by Ford Motor Company whose debt exceeded $114B.
In the United States, companies in need of cash issue bonds in the corporate bond market. Buyers of these bonds are essentially lending companies money, and picking up a coupon (interest) as long as they continue to hold that company’s debt.
According to the Federal Reserve and the Securities Industry and Financial Markets Association (SIFA), US companies now face the highest debt levels on record, at more than $10.5 trillion. In 40 years the amount of corporate bonds outstanding has grown by over 2,000%, from 16% of US GDP in 1980, to 50% of GDP in 2020.
Forbes notes the level of corporate debt is actually much higher because the above-mentioned figures only include fixed income debt, not loans and lines of credit.
These debt levels were massive even before the coronavirus (about $9 trillion), with rock-bottom interest rates left over from the financial crisis making it very easy for corporations to borrow money.
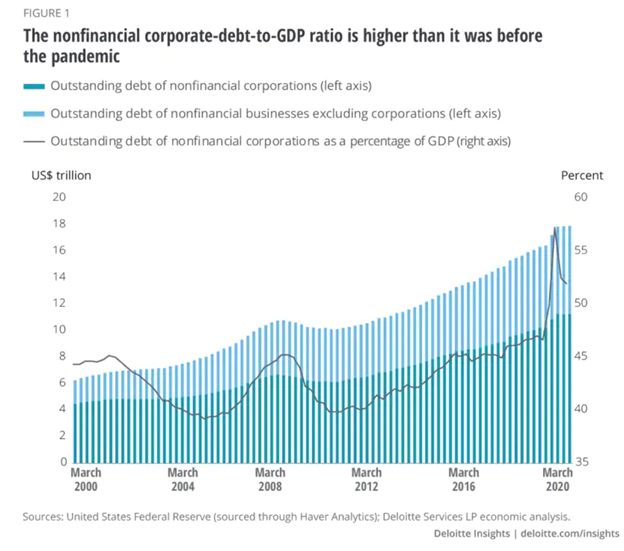
According to accounting firm Deloitte, the corporate debt surge in 2020 was likely due to at least one of three factors: 1/ some businesses were forced to borrow to keep operations running as large swaths of the economy shut down; 2/ some had to invest in technology to support remote work; and 3/ not all businesses were worse off due to covid-19, consequently some of them needed to borrow to grow their enterprises.
Whatever the reason for rising leverage, Deloitte found that non-financial business debt at the end of 2020 was 82% of GDP, higher than the (pre-pandemic) third-quarter 2019 ratio of 75%.
There has been talk of a “corporate bond bubble” triggering the next financial crisis, after the Fed took extraordinary measures at the beginning of the pandemic to buy corporate bonds — part of a $250 billion program funded by the CARES Act. Questions emerged about why the Fed was purchasing the bonds of companies that really didn’t need their help, including such economic stalwarts as Microsoft, Visa and Home Depot. Moreover, several of them had “junk bond” as opposed to “investment-grade” status, such as Heinz, Ford and Macy’s. “The corporate bond market is hanging on right now by a very precarious string. How long can we continue to live on red ink?” asks a March 12 CNBC video on the subject.
Most of the $10.6T in US corporate debt is made up of bonds (the other part is loans), which as mentioned, are divided into investment-grade and high-yield/ junk bonds. Independent ratings agencies decide on the classification, based on a company’s ability to make their debt payments to bondholders.
The danger is if the bond market crashes, which could happen if enough companies are unable to pay their debts (ie. redeem bonds upon maturity plus interest). The bond market is several times larger than the stock market, amplifying the risk of a crash. “When the bond market blows a gasket, the damage is much worse for the economy,” states the CNBC video.
Right now the corporate bond picture looks good because interest rates are so low. Again, it’s very easy for companies to issue bonds and to get investors to purchase them. They much prefer to do this rather than dip into their own cash piles, or issue stock which dilutes the share float.
But problems occur when companies get reckless with their debt, resulting in a status downgrade. Currently there are a number of companies teetering on the edge of investment-grade status. When they are downgraded to junk bond status, a lot of bond investors sell these “fallen angels”. In 2020 50 companies worth $200 billion in debt were downgraded, including Macy’s, Ford and Occidental, compared to $40-50B in a normal year.
Companies unable to find enough investors to buy their corporate bonds may go bankrupt. Equally bad, if a company is unable to pay back the principal plus interest on bonds when they reach maturity, the firm could default on its loans.
The number of bankruptcies during all of last year and the first quarter of 2021 were above average. According to Forbes, in March 2021 there were 61 corporate bankruptcies, double the amount in February, with consumer discretionary companies and industrials comprising the largest number of business failures.
As the CBNC video notes, defaults last year would have been higher if not for the Fed buying corporate debt for the first time. “The amount of bonds that the Fed actually purchased was very small versus what they could. Just the Fed announcing it, setting it up, doing a little bit, was more validating to the market, than the actual need, desire to buy everything.”
The huge amount of corporate debt is benign for now, but what happens if the Fed hikes interest rates to deal with rising inflation? This is a very real possibility if inflation stays above the Fed’s 2% target for much longer.
“Even a 100, 150-basis point interest rate could spell doom for a company that’s living on the edge,” says the CBNC video, referring to so-called zombie companies that are drowning in debt, to the point where they could default on their loans. These companies are only making interest payments, they’re not investing in their businesses or employees, meaning they ultimately are dragging down national economic growth.
Yet poorly managed companies are still qualifying for loans and issuing debt. An analysis earlier this year by S&P Global Market Intelligence found that “a record-high $67.4 billion was issued in the first quarter from borrowers with a B- corporate rating on at least one side. That represents 40% of total issuance during the quarter. Note that for any full year the share of comparable B- issuance has never been above 36%.”
If ability to repay debt is the main concern, the above-mentioned Deloitte report makes some interesting observations.
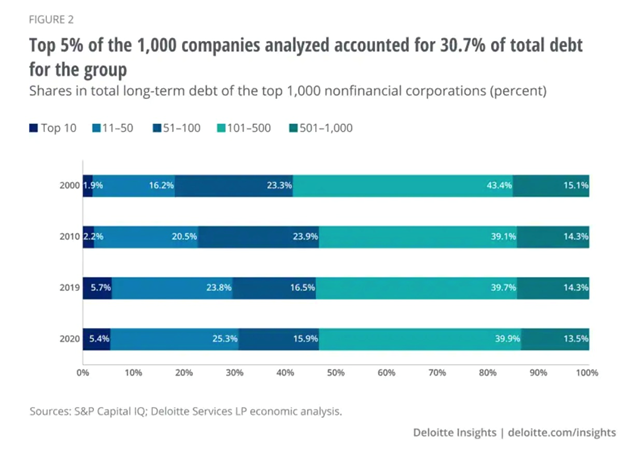
First, analysis of the data by cohorts reveals that the top 50 companies by market value are leading the debt surge, with only 5% of 1,000 companies accounting for 30.7% of the group’s total long-term debt.
Second, ability to repay debt has deteriorated for all companies except the largest ones. For example during the pandemic, the ratio of net debt to earnings before interest, taxes, depreciation and amortization (EBITDA) fell by 18.2% for the 501-1,000 and by 16.7% for the 101-500 cohort. The top-10 cohort was better placed than others in its net debt to EBITDA ratio.
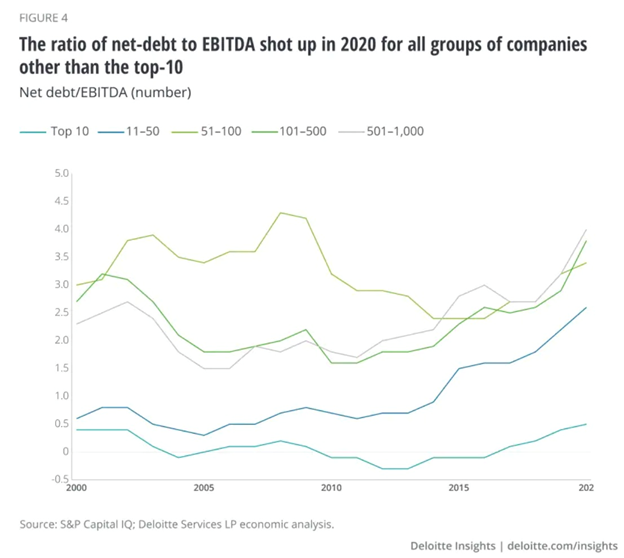
Third, the pandemic affected most companies’ ability to pay interest on their debt, again with the exception of the top-10 cohort. The interest coverage ratio — a ratio of earnings before interest and taxes (EBIT) — fell for all cohorts except the top-10 in 2020, with EBIT dropping by 40.3% for the 501–1,000 cohort and by 28.5% for the 101–500 one.
Deloitte’s analysis suggests there is inequality with respect to corporate debt and companies’ ability to pay it off. Only 5% of 1,000 companies account for 30.7% of this group’s debt, and these companies are least likely to default on their debts or fail to pay the interest on their debts. This means 95% of the other 1,000 companies in Deloitte’s study group hold 70% of the rest of the debt, with the pandemic impacting most’s ability to repay.
How many of these 950 companies are zombies on the edge of bankruptcy or are close to being downgraded to junk bond status? The $10.6 trillion in corporate debt is certainly something we as investors need to be aware of and keep tracking, so as to stay ahead of a potential meltdown if many companies begin defaulting on their loans.
Household debt
In the United States, consumer spending makes up nearly 70% of GDP, meaning the ability of households to spend, and to handle debt burdens, is of utmost importance. Globally the figure is similar.
Household debt is defined by Stats Canada as mortgage debt on all residences and real estate, and consumer debt (including debt outstanding on credit cards, personal and home equity lines of credit, secured and unsecured loans from banks and other institutions, and unpaid bills).
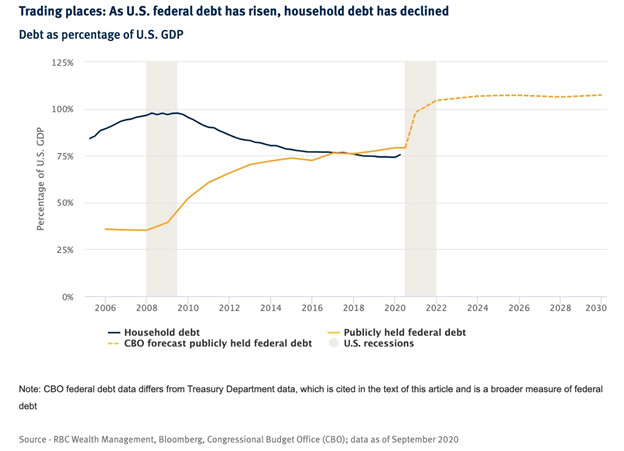
In its recent report, RBC notes that in some countries, household debt is of greater concern than government debt. In other countries the reverse is true. For example in the decade following the financial crisis, Canada’s household debt rose from 93% of GDP to 106%, compared to federal debt falling from 47% to 40%; whereas in the US, government debt has surpassed household debt and continues to swell.
In the OECD bar graph below, countries are ranked according to their total household debt as a percentage of net income. Denmark leads the pack with household debt greater than 250% of income, followed by five other European countries, then Korea. Canada is ninth at 175%, with the US 19th at 105%.
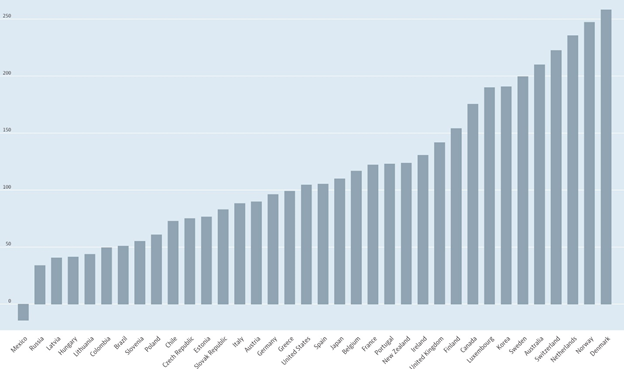
Household debt as a percentage of net income. Source: OECD
Getting more granular, CNBC reports that US consumer debt rose to nearly $14.6 trillion at the end of 2020, driven by a record-breaking increase in mortgages, which in February totaled over $10 trillion, as home buyers took advantage of low mortgage rates. Mortgage debt in Q4 2020 increased 1.4%, or $206 billion, making it the fastest fourth-quarter rise since 2006.
Student loan debt last year increased marginally to $1.37 trillion as a result of low interest rates and student loan forgiveness (this week the Biden administration announced it will cancel another $5.8B of student loan debt by the end of this year), while credit card debt fell by $108B to $820B. Many Americans, holed up at home either unemployed or working remotely, elected to save money during the pandemic or pay down loans with help from direct stimulus checks. The “serious delinquency rate” or 90 days past due for all debt, fell from 2.36% to 1.25% during the fourth quarter 2020.
However it appears that Americans’ parsimony was shortlived.
A more recent CNBC story states that household debt jumped the most in 14 years in the second quarter of 2021. Though mostly driven by the housing market, credit card debt is reportedly back on the rise.
Despite significant paying down card balances, the average balance is above $5,000 and there are signs that fiscal prudence may be waning, including the fact that government stimulus checks are slowing, and that consumers are in the mood for spending, with around $2 trillion in forced savings ready to be unleashed.
A Creditcards.com survey quoted by CNBC found 44% of people saying they are willing to take on debt in the second half of 2021 for non-essential purchases, such as dining out.
A May report from the Federal Reserve found that credit card balances rose 11% from April to May, the largest increase in five years. On Aug. 4, the Fed reported the highest second-quarter jump in household debt in 14 years, to nearly $15 trillion.
Conclusion
As stated at the top, the Fed is severely constrained in how much it can raise interest rates, to quell rising inflation, due to ballooning debt.
Following $4.5 trillion already spent on pandemic relief, and trillions more to come, through Biden administration spending, along with the continuation of quantitative easing (what I like to call “quantifornication”) to the tune of $120 billion in asset purchases per month, the Fed has in one year doubled its balance sheet to around $8.2 trillion and the national debt currently sits at $28.6 trillion.
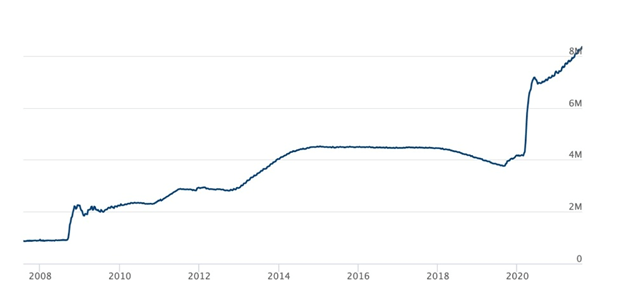
Total assets of the US Federal Reserve. Source: Federal Reserve
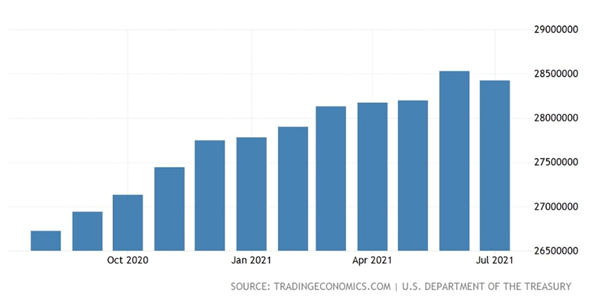
US national debt over the past year
Interest paid by the federal government this year on its debt is estimated at just under $400 billion.
By our calculations the national debt could reach $34 trillion this year and that is excluding the nearly $5 trillion in federal budget deficits expected in 2021/22.
By 2031 the Congressional Budget Office predicts as deficits grow and interest rates eventually rise, the debt to GDP ratio could reach 202% from its current 125%. At that rate, for every dollar the US economy produces, $2 is borrowed.
As we have shown, the massive debt overhang is not only an American problem.
Governments, companies and households raised $24 trillion last year to offset the pandemic’s economic toll, bringing total global debt to an all-time high, at the end of 2020, of $281 trillion. Countries with large budget deficits are expected to add another $10 trillion in 2021, pushing their global debt accumulation past $92 trillion by year’s end.
As central banks around the world hold interest rates near 0%, to ensure that their economies keep growing, companies have taken on fresh loans and issued tens of trillions in bonds.
Global debt in the financial sector hit 86% of GDP in 2020, the largest increase since 2007. The debt of non-financial corporations has nearly doubled, from $46.6 trillion in the second quarter of 2009 to $81T in the third quarter of 2020.
The ability to repay debt has deteriorated for all companies except the largest ones, creating a kind of “corporate debt inequality” whereby many businesses risk being dumped, from investment-grade to junk-bond status. If interest rates are raised by even 100 basis points, we could be in for a slew of debt defaults and bankruptcies.
In 2020 50 companies worth $200 billion in debt were downgraded, five times the dollar amount in a normal year.
We talk about government debt, corporate debt and household debt, as though they were separate, but in reality, households, ie., “your average Joe and Jane”, are ultimately the ones paying the piper when all three levels of debt increase, and especially, when interest rates go up.
Consider: interest paid on the $28 trillion national debt is currently $400 billion, and that’s @ $0.15%. If rates go up, say to 0.6%, the interest on the debt jumps to $1.4 trillion. Raise it to 1.2%, and the federal government will be paying $2.8 trillion in interest, nearly the amount of the current budget deficit. Just for the interest!
Who pays this? Ultimately it’s the American consumer. Government revenues don’t bring in enough to cover it, so they only have two ways of raising the money: raise taxes or issue more debt. Raising taxes is political suicide, unless you’re a Democrat and support taxing high-wealth individuals and corporations. This though won’t help the little guy, because most companies will either find ways to avoid higher taxes or they will pass it onto their customers.
If the other route, debt issuance is chosen, the US government is asking bond-holders in-country and overseas not only to pay the interest on its existing debt, but the interest on the new debt being issued. To entice them into accepting what is looking to be more and more of a risky investment, the Fed must raise interest rates.
This affects corporations who have issued, and are obliged to pay back, with interest, trillions worth of corporate bonds, as well as individuals holding mortgages, car loans, student loans, etc.
US companies now face the highest debt levels on record, at more than $10.5 trillion. Attracted by low interest rates, these bonds seemed like a risk-free way for companies to borrow. With higher interest rates, they will quickly become an albatross around their necks. Mortgage holders will be faced with a sudden increase in monthly payments. The overleveraged will default, or be forced to sell, potentially triggering another housing crisis.
Consumers are already feeling the pinch of 5.4% inflation but now they must contend with even higher prices. This is because the companies who have floated all these corporate bonds, are now forced to raise the prices of their goods and services, so they can continue paying their bondholders and avoid debt default and/or bankruptcy.
The higher rates could also mean layoffs to preserve profit margins.
Remember too, there are still hundreds of billions worth of tariffs levied on imports by the previous Trump administration. These are effectively a tax on the American consumer, since most companies simply pass the cost of the tariff onto their customers.
The bottom line? The Fed simply cannot raise interest rates without killing the American consumer, whose spending is relied upon for economic growth, comprising two-thirds of GDP. But if inflation keeps rising as it has been, sooner or later they will have to, lest the United States becomes the “United States of Zimbabwe.”
QE’s success in holding down yields has eliminated the US Federal Reserve’s maneuvering room. The Fed must continue quantitative easing to monetize the issuing of Treasuries, which are needed to fund deficits.
“[T]he Fed cannot increase interest rates as long as the politicians keep creating billions of new debts,” affirms Ron Paul, in an opinion piece about the 50th anniversary of President Nixon taking the United States off the gold standard.
With respect, Mr. Paul, the federal government is creating trillions, not billions, in new debt.
How did we get here? For the answer to that question, read Part 2 of this series, ’50 years of fiat folly’.
Richard (Rick) Mills
The story above was initially published in August 2021. Parts 2 and 3 to follow shortly.
Richard is the owner of Aheadoftheherd.com and invests in the junior resource/bio-tech sectors. His articles have been published on over 400 websites, including:
WallStreetJournal, USAToday, NationalPost, Lewrockwell, MontrealGazette, VancouverSun, CBSnews, HuffingtonPost, Londonthenews, Wealthwire, CalgaryHerald, Forbes, Dallasnews, SGTReport, Vantagewire, Indiatimes, ninemsn, ibtimes and the Association of Mining Analysts.
If you're interested in learning more about the junior resource and bio-med sectors, and quality individual company’s within these sectors, please come and visit us at www.aheadoftheherd.com
Content included in this article is not by association necessarily the view of FNArena (see our disclaimer).
Legal Notice / Disclaimer
This document is not and should not be construed as an offer to sell or the solicitation of an offer to purchase or subscribe for any investment.
Richard Mills has based this document on information obtained from sources he believes to be reliable but which has not been independently verified.
Richard Mills makes no guarantee, representation or warranty and accepts no responsibility or liability as to its accuracy or completeness. Expressions of opinion are those of Richard Mills only and are subject to change without notice. Richard Mills assumes no warranty, liability or guarantee for the current relevance, correctness or completeness of any information provided within this Report and will not be held liable for the consequence of reliance upon any opinion or statement contained herein or any omission.
Furthermore, I, Richard Mills, assume no liability for any direct or indirect loss or damage or, in particular, for lost profit, which you may incur as a result of the use and existence of the information provided within this Report.
Technical limitations
If you are reading this story through a third party distribution channel and you cannot see charts and other illustrations included, we apologise, but technical limitations are to blame.
Find out why FNArena subscribers like the service so much: "Your Feedback (Thank You)" – Warning this story contains unashamedly positive feedback on the service provided.
FNArena is proud about its track record and past achievements: Ten Years On