Commodities | Jul 24 2007
By Greg Peel
“This time, we look for spot gold to consolidate its recent gains, to trade down just under the resistance for a day or two or three in order to, in military terms, restore its supply lines, consolidate its forces and then lead another assault upon those highs. This time, however, the assault shall come from nearer taken land than in the past. Armies that have to march great distances and engage the enemy directly do so at great risk. However, armies that have been able to draw near to the enemy without engaging him after a long march, can rest, can unify their supply lines, can co-ordinate the next assault and then prevail. That, we surmise, shall be gold’s way this time.”
And that’s the way the gold bugs see it – as a battle. A battle against the forces of evil, namely central bank selling, particularly just below the US$700/oz mark.
Nevertheless, the author of the above analogy – Dennis Gartman – is not a gold “bug”. He is merely an astute trader who is long of gold at present and is anticipating the next assault on levels above US$690/oz. Gartman acknowledges there has been a major selling wall at these levels, but has no particular interest in getting tied up with any conspiracy theories. Whether or not GATA is right is by the by.
The gold bugs do believe there is a concerted effort by the official market, and the US officials in particular, to support the US dollar by not letting gold rally to levels the bugs believe should reflect the true picture. While every other dollar-denominated commodity, from oil to copper to the Dow Jones, has hit record highs as the US dollar hits record lows, gold has been stuck in a cage. Eventually, the bugs believe, the forces of good will prevail.
Which brings us to this latest assault. What is different this time? Well for starters, the US dollar is a lot lower. And then there is a confluence of other factors – those factors that will bolster Gartman’s army.
Firstly, retail funds buying has returned to the market. ETF traders have had a tough time since late 2005, when a surging rally gave way to a blow-off correction and every subsequent rally has been slapped down with contempt. But as surely as ETF holders have bailed on the snakes, they have reinstated on the ladders. They are repositioning themselves again, market observers note, which goes some way to explaining gold’s recent push.
Secondly, gold has been wallowing these last couple of months in between traditional Asian jewellery buying seasons. It must always be remembered that a good 75% or more of mined gold ends up as jewellery, and thus jewellery demand plays a vital role in determining the price of gold. To that end, the gold bugs are cheering on Rakshabandhan and Janamashtmi. Reports from New Dehli suggest that these two imminent festivals and the not far off Indian marriage season are already encouraging Indian jewellery fabricators to get in before the price runs away. As well as rising in US dollar terms, gold has been rising in rupees.
Thirdly, and perhaps most importantly, the signs are good for gold in the paper market. According to exchange data, open positions in gold futures have been shrinking as the market has risen this time. This implies that short positions are being unwound. Gold bugs are excited about this as they know that the big paper sellers of gold are agents of the aforementioned evil empire, being the “gold banks”. If the paper shorts aren’t building, is it possible the gold banks will let the metal go this time? The US dollar is after all a lot lower, and that must hurt.
But that’s just the fundamental side of gold. From a technical perspective, the tea-leaf readers are besides themselves as well.
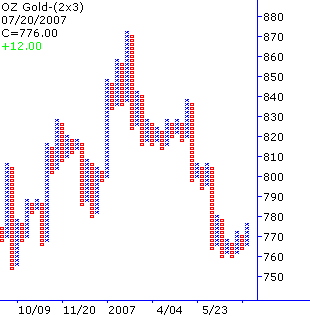
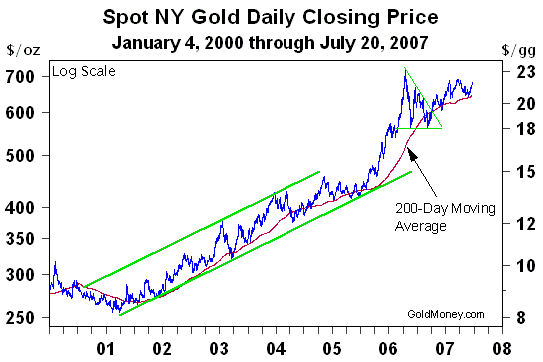
Marketwatch.com gold fan Peter Brimelow has made note of the point and figure charts provided by The-Privateer.com. Below is a recent chart of the gold price, but below that is a 1×3 point-and-figure chart. Without going into too much detail, point-and-figure charts note only significant price moves – not all of them.
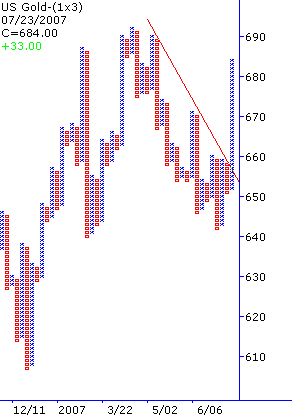
That’s what some people call a “break-out”. But perhaps more interesting is the equivalent chart against the euro. As regular readers would know, there are those more sober gold watchers who are not prepared to get excited until gold can rally in euro terms as well as US dollar terms. Otherwise gold’s rally is merely a manifestation of dollar weakness.
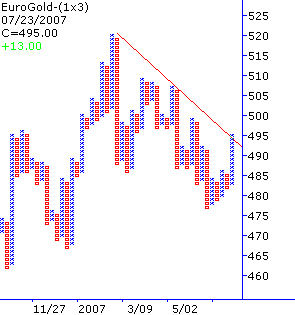
That looks fairly encouraging. Now add it to Dennis Gartman’s normal euro chart and we have what can probably be considered a break-out for gold in euro terms as well. The real test will be the psychological EUR500/oz level, says Gartman. If that is broken, look out.
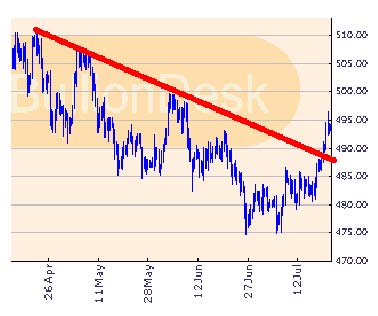
But wait, there’s more.
It has been another concern for gold watchers over the past several months that the share prices of global gold miners have failed to respond to any apparent strength in the gold price. Although it may seem intuitive to accept that the gold price leads mining stock prices, indeed veteran traders know that if the mining stocks start to move, the gold price will follow. This is because the smart money is setting itself in anticipation. And the big global gold mining stocks have begun to push higher, recently outperforming the price of gold.
Put this altogether, and gold bugs are looking at not only a breach of US$700/oz this time around but a quick run up to US$720/oz. They have been disappointed so many times now, it really must feel like the one last military push.
Australian investors cannot, unfortunately, be too excited though. While gold is beginning to rise in terms of the US nemesis currency – the euro – the little Aussie battler has run so hard that Aussie gold has just not performed at all. And further US dollar weakness, which everyone expects, will not help. For gold to rally in Aussie dollar terms it must rally very, very hard in US dollar terms.
